Decision trees are a fundamental machine learning technique that every data scientist should know. Luckily, the construction and implementation of decision trees in SAS is straightforward and easy to produce.
There are simply three sections to review for the development of decision trees:
- Data
- Tree development
- Model evaluation
Data
The data that we will use for this example is found in the fantastic UCI Machine Learning Repository. The data set is titled “Bank Marketing Dataset,” and it can be found at: http://archive.ics.uci.edu/ml/datasets/Bank+Marketing#
This data set represents a direct marketing campaign (phone calls) conducted by a Portuguese banking institution. The goal of the direct marketing campaign was to have customers subscribe to a term deposit product. The data set consists of 15 independent variables that represent customer attributes (age, job, marital status, education, etc.) and marketing campaign attributes (month, day of week, number of marketing campaigns, etc.).
The target variable in the data set is represented as “y.” This variable is a binary indicator of whether the phone solicitation resulted in a sale of a term deposit product (“yes”) or did not result in a sale (“no”). For our purposes, we will recode this variable and label it as “TARGET,” and the binary outcomes will be 1 for “yes” and 0 for “no.”
The data set is randomly split into two data sets at a 70/30 ratio. The larger data set will be labeled “bank_train” and the smaller data set will be labeled “bank_test”. The decision tree will be developed on the bank_train data set. Once the decision tree has been developed, we will apply the model to the holdout bank_test data set.
Tree development
The code below specifies how to build a decision tree in SAS. The data set mydata.bank_train is used to develop the decision tree. The output code file will enable us to apply the model to our unseen bank_test data set.
ODS GRAPHICS ON; PROC HPSPLIT DATA=mydata.bank_train; CLASS TARGET _CHARACTER_; MODEL TARGET(EVENT='1') = _NUMERIC_ _CHARACTER_; PRUNE costcomplexity; PARTITION FRACTION(VALIDATE=0.3 SEED=42); CODE FILE='/mypath/bank_tree.sas'; OUTPUT OUT = SCORED; run; |
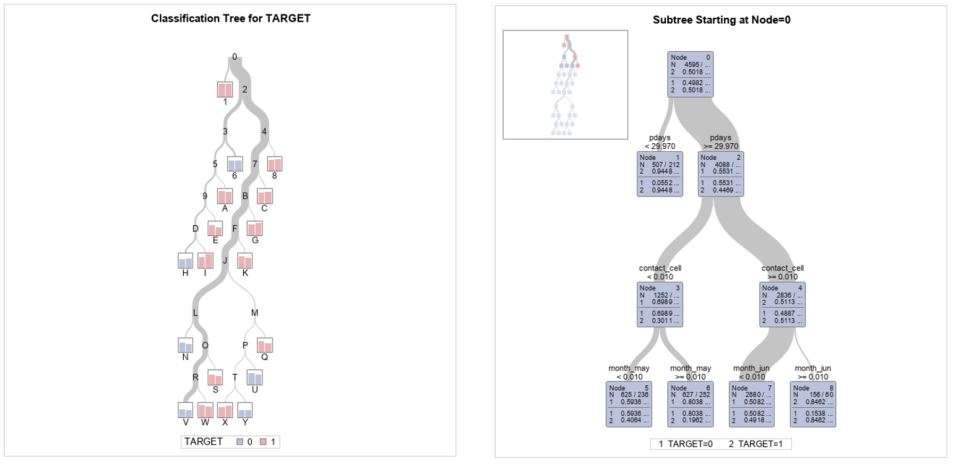
The output of the decision tree algorithm is a new column labeled “P_TARGET1”. This column shows the probability of a positive outcome for each observation. The output also contains the standard tree diagram that demonstrates the model split points.
Model evaluation
Once you have developed your model, you will need to evaluate it to see whether it meets the needs of the project. In this example, we want to make sure that the model adequately predicts which observation will lead to a sale.
The first step is to apply the model to the holdout bank_test data set.
DATA test_scored; SET MYDATA.bank_test; %INCLUDE '/mypath/bank_tree.sas'; RUN; |
The %INCLUDE statement applied the decision tree algorithm to the bank_test data set and created the P_TARGET1 column for the bank_test data set.
Now that the model has been applied to the bank_test data set, we will need to evaluate the performance of the model by creating a lift table. Lift tables provide additional information that has been summarized in the ROC chart. Remember that every point along the ROC chart is a probability threshold. The lift table provides detailed information for every point along the ROC curve.
The model evaluation macro that we will use was developed by Wensui Liu. This easy-to-use macro is labeled “separation” and can be applied to any binary classification model output to evaluate the model results.
You can find this macro in my GitHub repository for my new book, End-to-End Data Science with SAS®. This GitHub repository contains all of the code demonstrated in the book along with all of the macros that were used in the book.
This macro on my C drive, and we call it with a %INCLUDE statement.
/* Or include directly from GitHub with */ /* filename sep URL "https://raw.githubusercontent.com/Gearhj/End-to-End-Data-Science/master/separation.sas"; */ /* %INCLUDE sep; */ %INCLUDE 'C:/Projects/separation.sas'; %separation(data = test_scored, score = P_TARGET1, y = target); |
The score script that was generated from the CODE FILE statement in the PROC HPSPLIT procedure is applied to the holdout bank_test data set through the use of the %INCLUDE statement.
The table below is generated from the lift table macro.
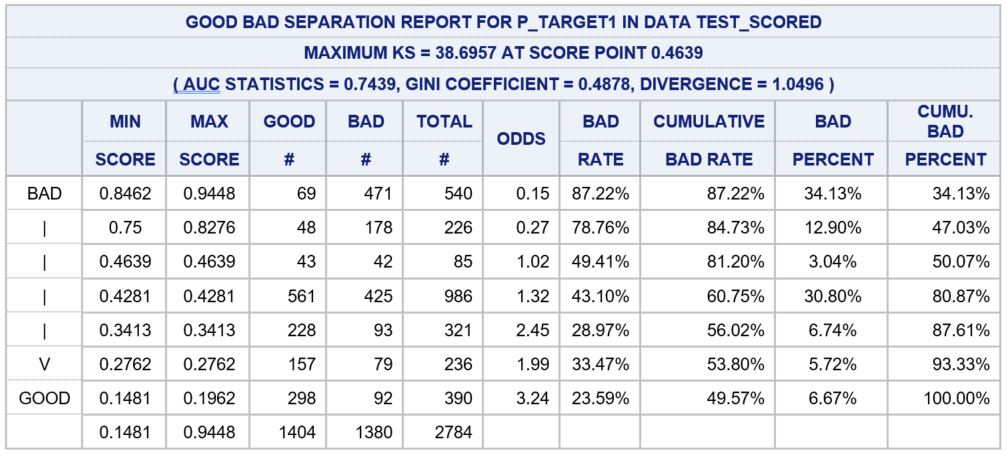
This table shows that that model adequately separated the positive and negative observations. If we examine the top two rows of data in the table, we can see that the cumulative bad percent for the top 20% of observations is 47.03%. This can be interpreted as we can identify 47.03% of positive cases by selecting the top 20% of the population. This selection is made by selecting observations with a P_TARGET1 score greater than or equal to 0.8276 as defined by the MAX SCORE column.
Additional information about decision trees along with several other model designs are reviewed in detail in my new book End-to-End Data Science with SAS® available at Amazon and SAS.com.

4 Comments
Hello James, I am having trouble running the macro on my sas studio sessions. What do i need to modify within the macro to allow it to run without errors I cant pinpoint the directory path it keeps displaying as an error.
Hi James,
I'd like to use HPSPLIT to illustrate a decision tree based on five categorical variables, the last level as the outcome. Let's call them Level1 through Level5 (outcome). To illustrate the null case or arrangement, I would like to force SAS to use a specific order of variables ending with the outcome variable. Is it possible to force SAS into following a specific order of variables for several levels in HPSPLIT before I begin entropy testing and scoring?
Thank you.
Thanks James, I had been meaning to dig into your book and now have another reason to do so.
Thanks for posting this James! I am just doing some sort of research, learning and experimentation with building, training and evaluating decision trees in SAS and I find it very useful, will try it right away 🙂 ! Cheers,
Alex Ginev